文明的用VS code來操作Gnuplot畫圖及簡易教學
有鑑於我們家老師真的對於gnuplot有特愛的偏好,而筆者也真的在上傳論文到IEEE系統時發生了字體被拒的問題(原先使用matplotlib的預設字體)
(更弔詭的是只有wiki系統有出現,CAI系統沒有OAO)
因此痛定思痛決定要找出可以比較聰明的使用gnuplot的方式
本文所提供的方法,只要在csv正確的情況下,可以即時預覽並用註解方式輸出eps png檔,已經算是很文明的做法了啦真的!
在使用本文所提到的 VS code + gnuplot 的方式,必須要先將要畫圖的資料弄成csv,算是少數可以在優化的地方,交給其他人來做了!
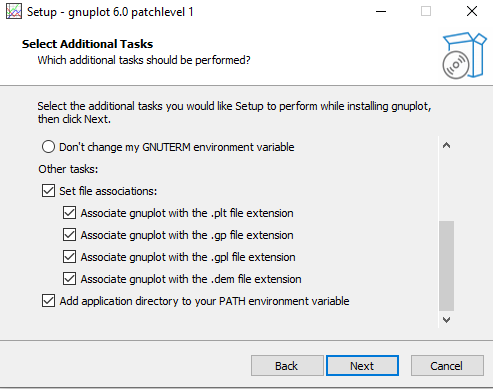
首先,先安裝Gnuplot
沒意外的話可以直接選最新版,沒有強制規定
安裝過程中要注意這幾個地方
- 請勾選為所有使用者安裝
- 一定要加入PATH,如果過程中忘記了,可以用以下方式重新添加

左下角開始右鍵->系統->右上角的進階系統設定->環境變數->
找到下面的系統變數的Path之後,按編輯->點選新增以下地址C:\Program Files\gnuplot\bin
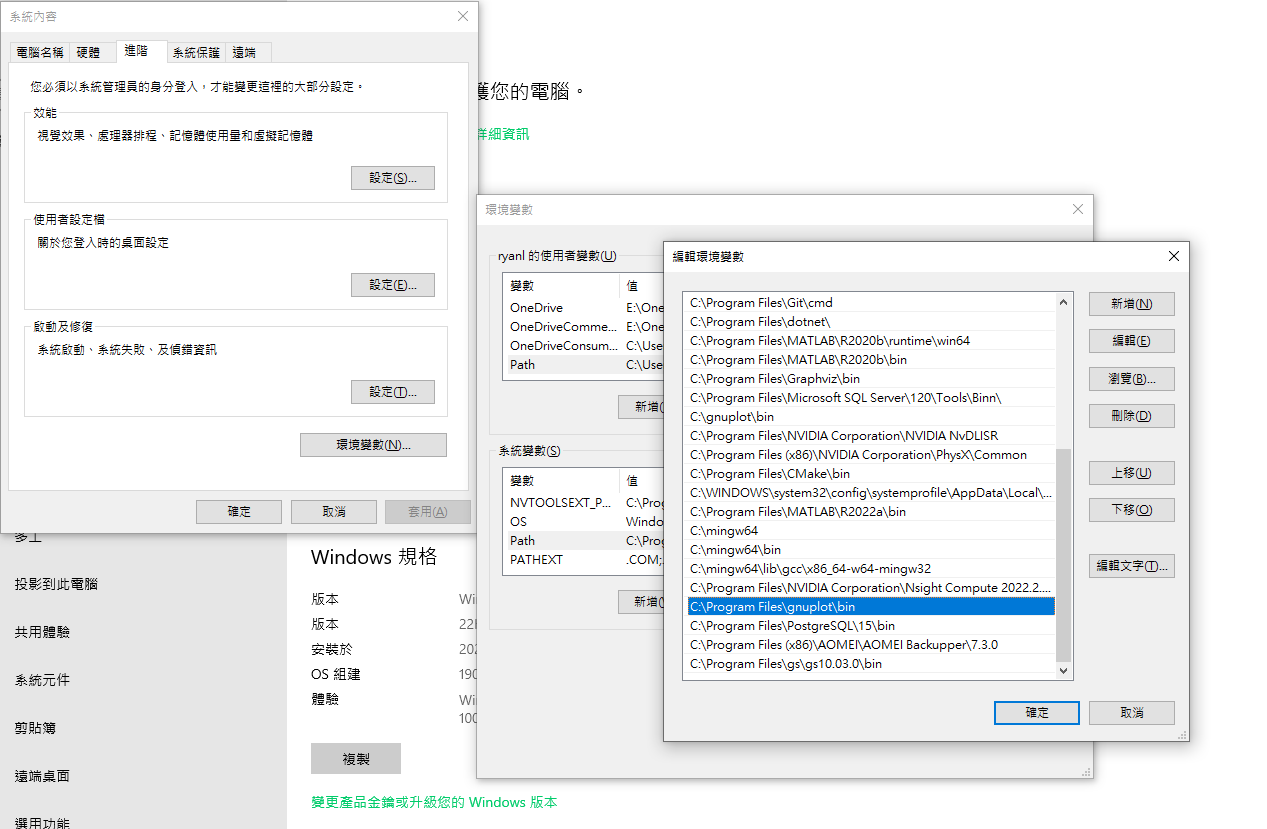
這樣就成功囉
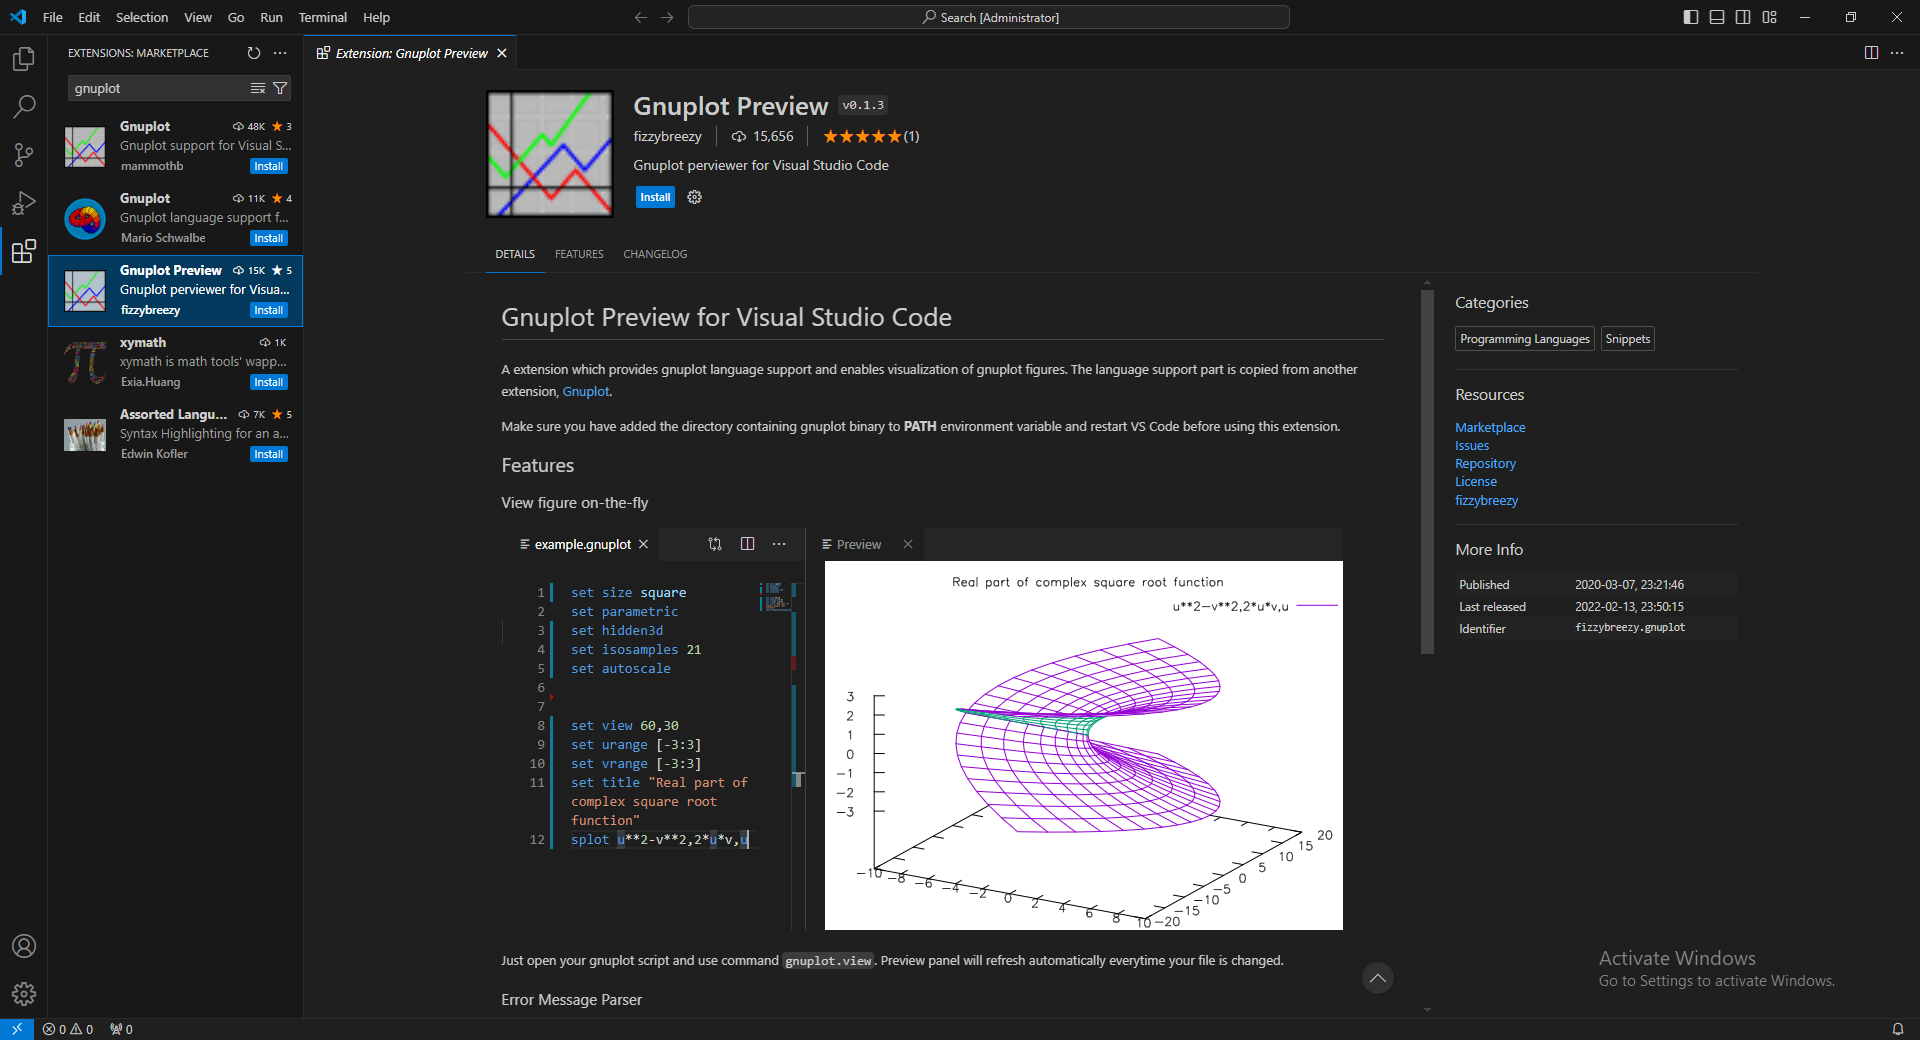
再來,進入VS code extension搜尋:Gnuplot preview
不要安裝錯了XD 我個人覺得這個最好用
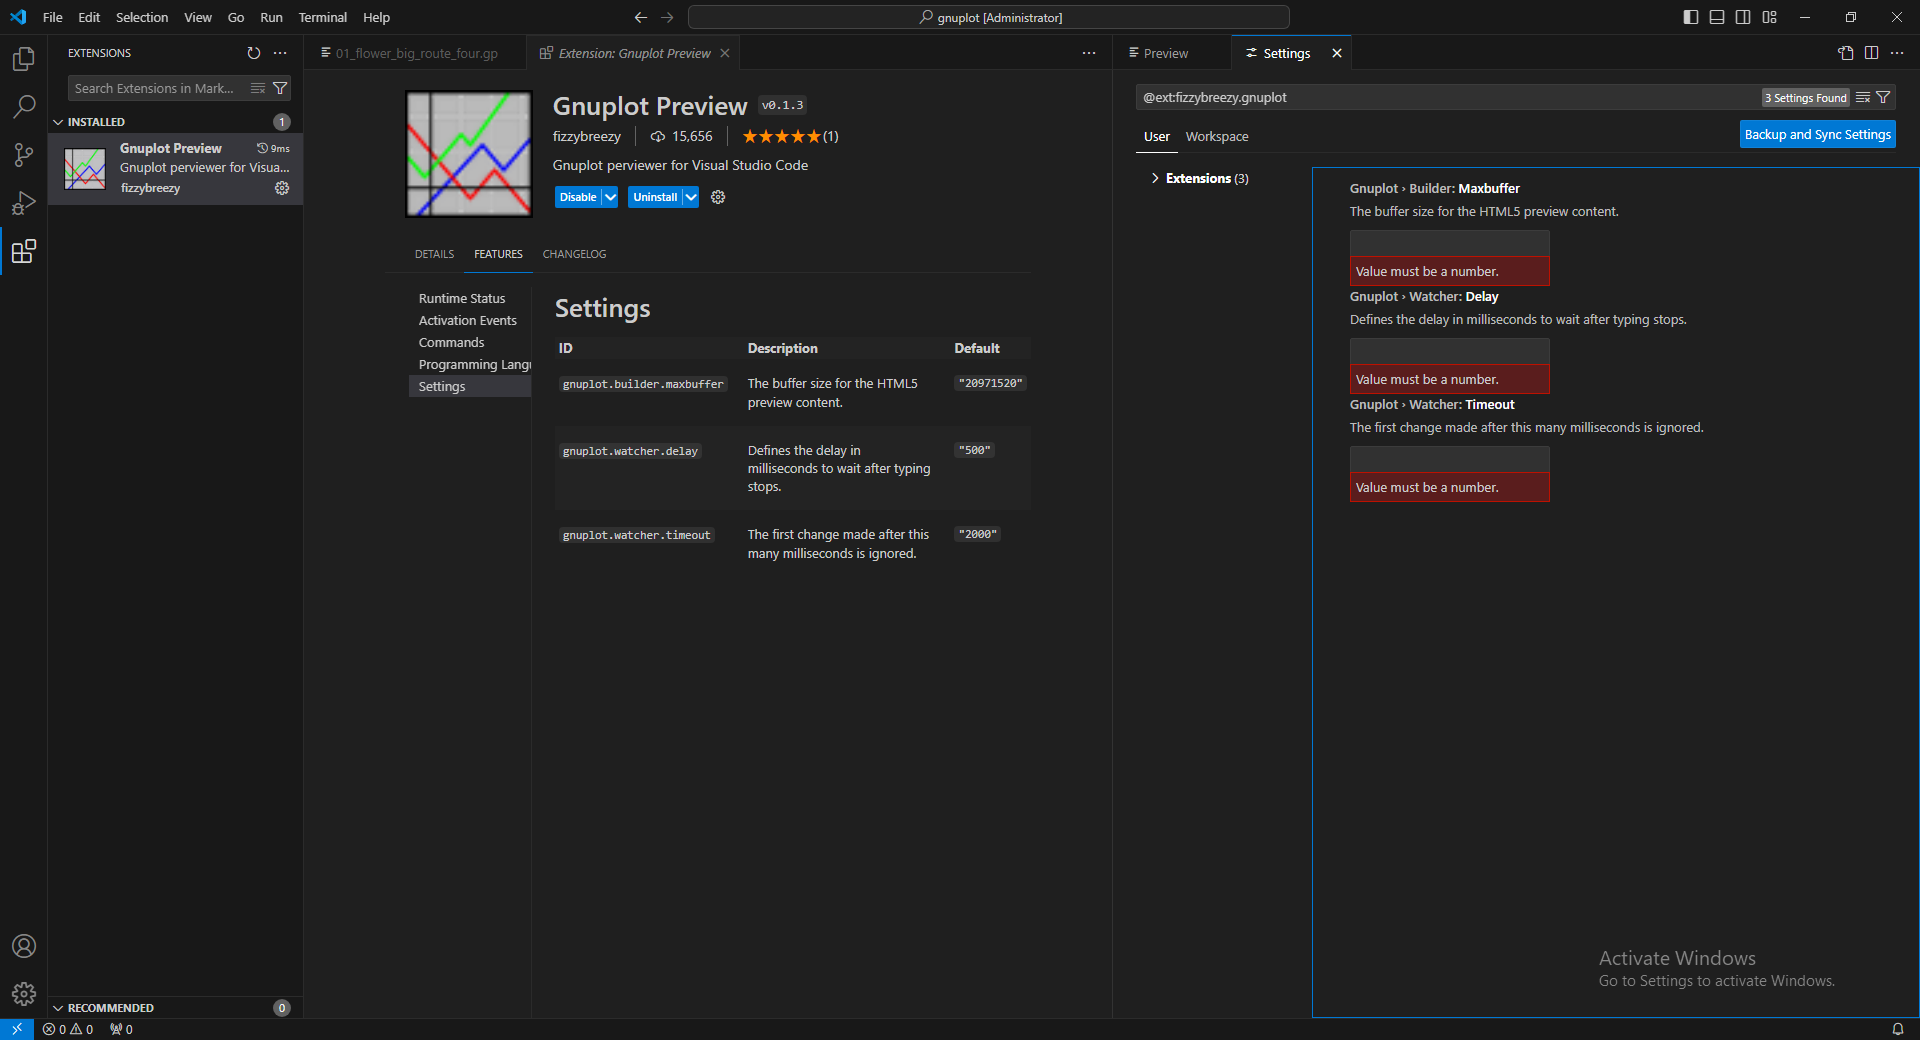
(可略)安裝完成後,在按他的齒輪,可以去設定他的反應時間
就安裝完成囉
簡易Gnuplot教學
基本上存Gnuplot的部分,副檔名可以是 .gp/.dem 之類的,但他們基本上本質都只是txt而已
這裡提供一組 .gp 的內容範例,只要按ctrl+alt+v即可即時預覽,如下圖:
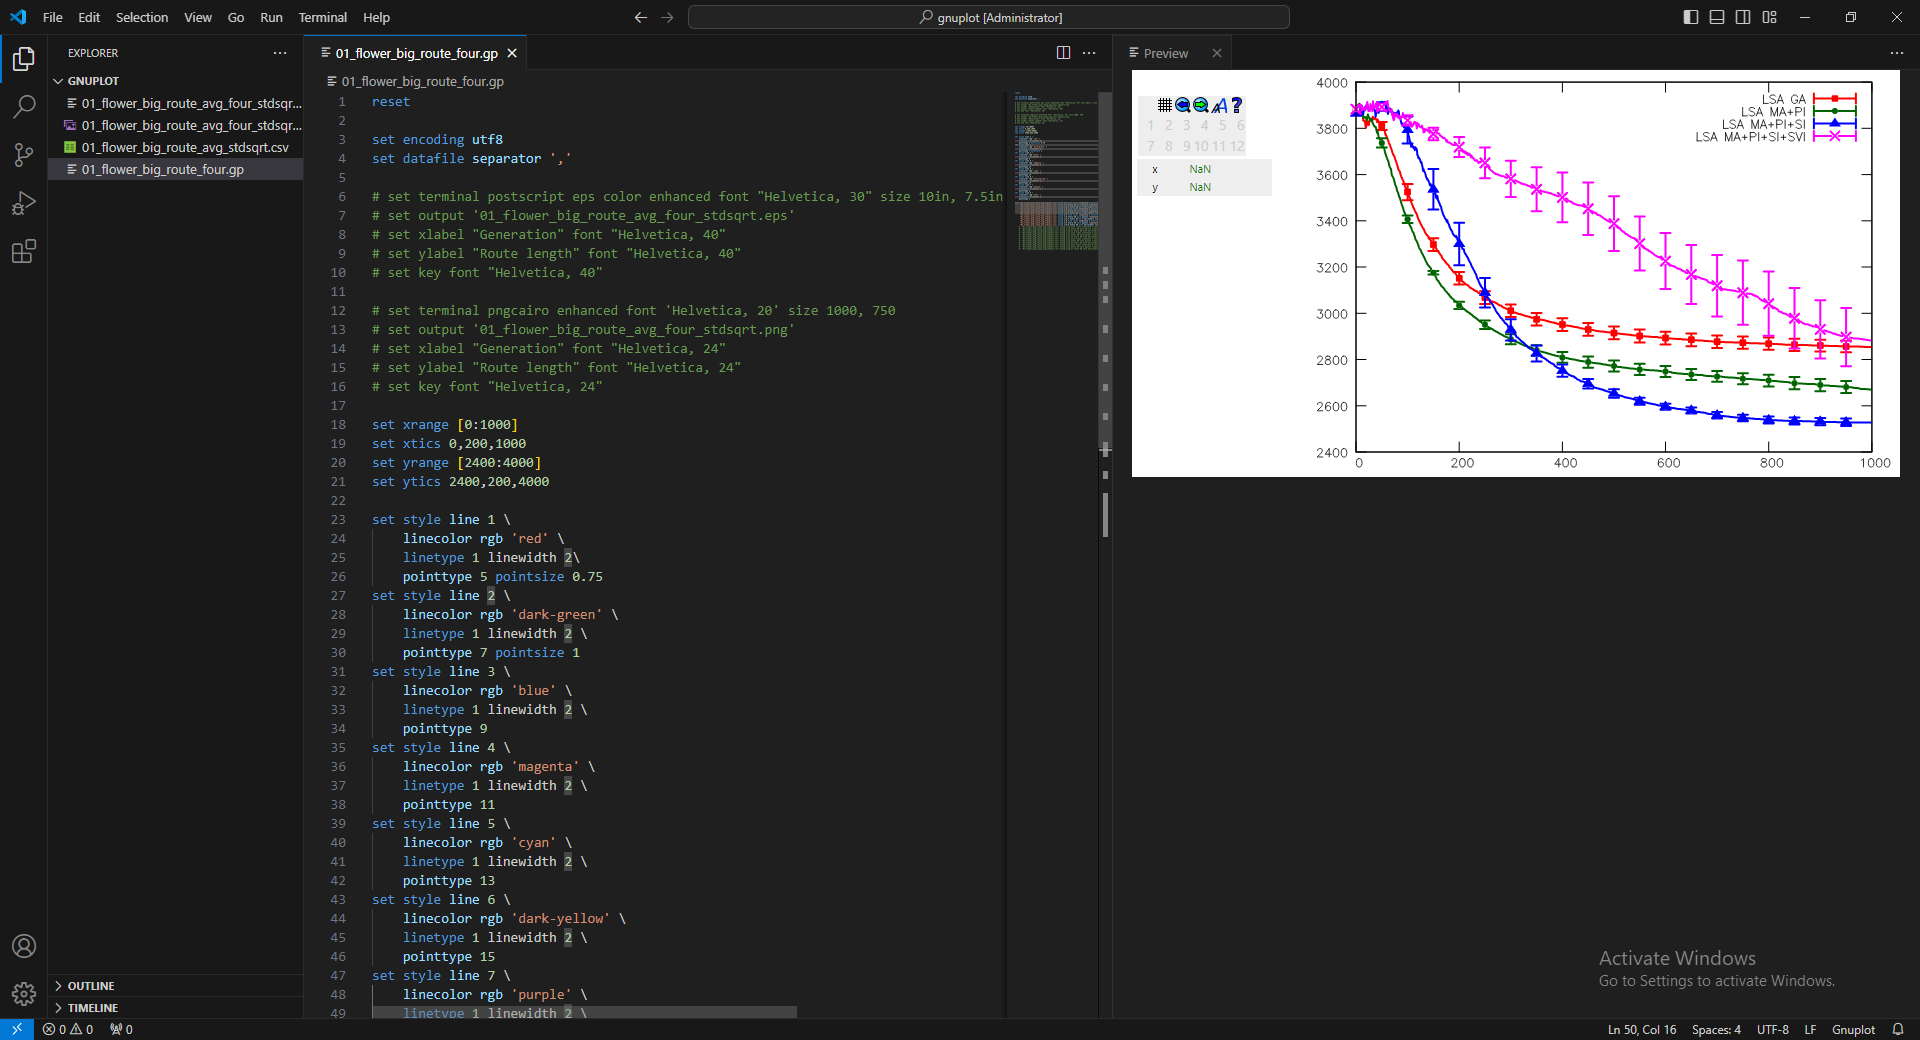
雖然在即時預覽時比例很怪,但是在輸出eps/png的時候會是正常的,以下提供幾個比較難理解的 code 解釋:
- 要注意:輸出eps/png只能擇一輸出註解,否則會輸出空白檔案
- 第06-11行是輸出eps的code,解除註解的話,會即時輸出eps出來
- 第13-17行是輸出png的code,解除註解的話,會即時輸出png出來
- 第19-22行是設定 x y 軸的數值範圍跟刻度範圍,要注意要多加一個小刻度以避免最左上角沒輸出到
- 第24-27行是一組點+線的設定值,顏色可以參考這篇,點線形式可以參考這篇,其餘以此類推
- 第57-59行是輸出一組完整線的部分,本code的做法是會將一條線分成3條不同的線顯示,其餘以此類推
- 抓第1欄當作x值,抓第2欄當作y值,線的格式,顯示線-格式1,不顯示legend
- 抓第1欄當作x值,抓第2欄當作y值,點的格式,每50個數據顯示一個點-格式1,不顯示legend
- 抓第1欄當作x值,抓第2欄當作y值,抓第3欄當作dy值,error bar的格式,每50個數據顯示一個bar-格式1,顯示legend
reset

set encoding utf8
set datafile separator ','

# set terminal postscript eps color enhanced font "Helvetica, 40" size 10in, 7.5in
# set output '01_flower_big_route_avg_four_stdsqrt.eps'
# set xlabel "Generation" font "Helvetica, 50"
# set ylabel "Route length" font "Helvetica, 50"
# set xtics font "Helvetica, 40"
# set ytics font "Helvetica, 40"

# set terminal pngcairo enhanced font 'Helvetica, 20' size 1000, 750
# set output '01_flower_big_route_avg_four_stdsqrt.png'
# set xlabel "Generation" font "Helvetica, 24"
# set ylabel "Route length" font "Helvetica, 24"
# set key font "Helvetica, 24"

set xrange [0:1000]
set xtics 0,200,1000
set yrange [2400:4000]
set ytics 2400,200,4000

set style line 1 \
    linecolor rgb 'red' \
    linetype 1 linewidth 2\
    pointtype 5 pointsize 0.75
set style line 2 \
    linecolor rgb 'dark-green' \
    linetype 1 linewidth 2 \
    pointtype 7 pointsize 1
set style line 3 \
    linecolor rgb 'blue' \
    linetype 1 linewidth 2 \
    pointtype 9
set style line 4 \
    linecolor rgb 'magenta' \
    linetype 1 linewidth 2 \
    pointtype 11
set style line 5 \
    linecolor rgb 'cyan' \
    linetype 1 linewidth 2 \
    pointtype 13
set style line 6 \
    linecolor rgb 'dark-yellow' \
    linetype 1 linewidth 2 \
    pointtype 15
set style line 7 \
    linecolor rgb 'purple' \
    linetype 1 linewidth 2 \
    pointtype 2
set style line 8 \
    linecolor rgb 'navy' \
    linetype 1 linewidth 2 \
    pointtype 3

plot "01_flower_big_route_avg_stdsqrt.csv" using 1:2 with lines linestyle 1 notitle, \
     "01_flower_big_route_avg_stdsqrt.csv" using 1:2 every 50 with points linestyle 1 notitle, \
     "01_flower_big_route_avg_stdsqrt.csv" using 1:2:3 every 50 with yerrorbars linestyle 1 title "LSA GA", \
     "01_flower_big_route_avg_stdsqrt.csv" using 1:4 with lines linestyle 2 notitle, \
     "01_flower_big_route_avg_stdsqrt.csv" using 1:4 every 50 with points linestyle 2 notitle, \
     "01_flower_big_route_avg_stdsqrt.csv" using 1:4:5 every 50 with yerrorbars linestyle 2 title "LSA MA+PI", \
     "01_flower_big_route_avg_stdsqrt.csv" using 1:6 with lines linestyle 3 notitle, \
     "01_flower_big_route_avg_stdsqrt.csv" using 1:6 every 50 with points linestyle 3 notitle, \
     "01_flower_big_route_avg_stdsqrt.csv" using 1:6:7 every 50 with yerrorbars linestyle 3 title "LSA MA+PI+SI", \
     "01_flower_big_route_avg_stdsqrt.csv" using 1:8 with lines linestyle 4 notitle, \
     "01_flower_big_route_avg_stdsqrt.csv" using 1:8 every 50 with points linestyle 4 notitle, \
     "01_flower_big_route_avg_stdsqrt.csv" using 1:8:9 every 50 with yerrorbars linestyle 4 title "LSA MA+PI+SI+SVI"
參考csv如此截圖: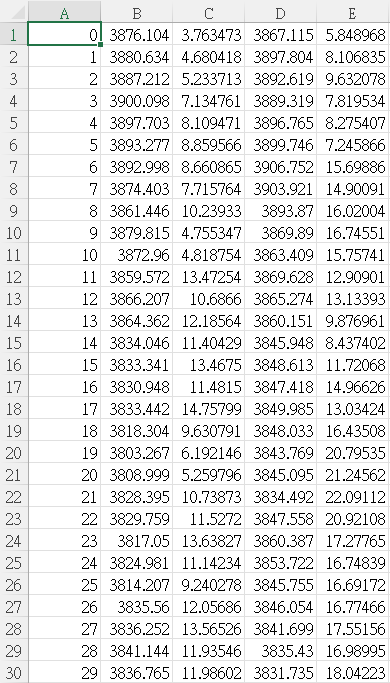
關於本gp檔、csv數據、字體,請洽傳承資料夾或上網搜尋其或衍伸字體(不確定的印象中在iOS系統是內建的)